

Analysis UK Financial Benchmarking Further Education 12.10.2026
A low number isn't always a symptom. Sometimes it's a strategy
A few months ago, I was in a conversation with several college CFOs when one of them said something that's stayed with me since.
We were collectively struck by what appeared to be a cost anomaly: the college in question was spending notably less than others on marketing activity. The variance was enough to prompt the usual questions around brand strength, recruitment reach and potential under-investment. But the explanation was immediate, and completely deliberate.
“We made a choice. Put the budget into teaching, into the student experience, and let that do the marketing for us.”
The theory in this college was built on a simple belief: that students who have a genuinely good experience become the college's best recruitment channel through word of mouth, and reputation and results, and that this would prove more cost-effective than any campaign.
I've spent years prefacing benchmarking conversations with the same caution: low costs don't always mean ‘good’, and high costs don't always mean ‘bad’. I hold onto that principle, but I still look for material differences and ask why they're there. However, this conversation reframed something for me. A low number isn't always a symptom. Sometimes it's a strategy. The obvious next question is whether the wider data backs that instinct up or whether it's just one college's story.
What Does the Data Actually Show?
There has to be some faith involved here, because the theory only stands up if the underlying claim is true: that teaching quality and student experience really are a college's best form of marketing.
It's worth dealing with the obvious challenge directly, rather than skirting round it. For some colleges, this genuinely is a strategic choice. For others, lower marketing costs may simply reflect a lack of other regional options for school leavers resulting in a reliable stream of demand regardless of spend. Higher proportional investment in teaching and student experience doesn't automatically signal a deliberate strategic bet either. So rather than reading the result as a symptom of good or bad management, it's more useful to treat it as an output worth questioning, not a verdict.
Can investment in the Student Experience replace Marketing expenditure?
Probably not, and we cannot say that increasing teaching and student experience investment results in higher student retention and achievement. The interesting questions conceived from this data might be, how are some colleges investing proportionally similar in teaching delivery yet achieving notably different student outputs?
Achievement and retention rates (NART, same benchmarking period) plotted against marketing spend as a proportion of core income.
Fig. 1
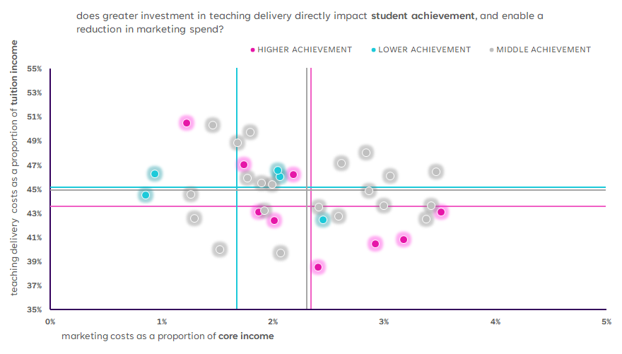
>=91% Higher Achievement
<=86% Lower Achievement
Fig. 2
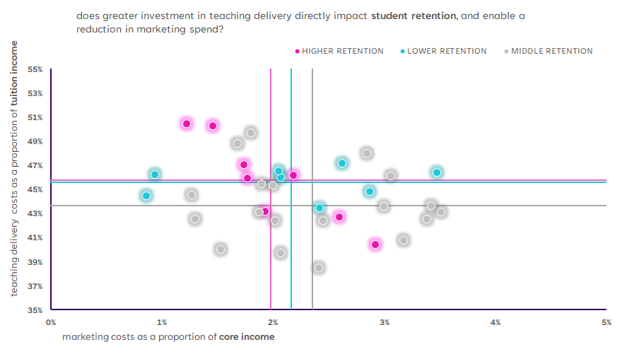
>=95% Higher Retention
<=92% Lower Retention
When you plot student outcomes against marketing spend across the sector, you can't draw a single, clean line through the data. Colleges investing similarly in teaching delivery achieve very different outcomes. Colleges spending very different amounts on marketing land in similar places on achievement and retention.
That's not a disappointing result, it's the actual finding, and a genuinely useful one. It means the number alone can't tell you whether an approach like this is working. Some of the colleges spending least on marketing sit among the highest achievers. Some sit among the lowest. The comparative data shows you where to look. It doesn't do the looking for you.
Choices Driving Other Cost Profile Differences
It's worth noting this isn't only about marketing budgets. I've seen a version of the same underlying choice play out in Admissions.
Teaching and Student Experience spend plotted against NART retention
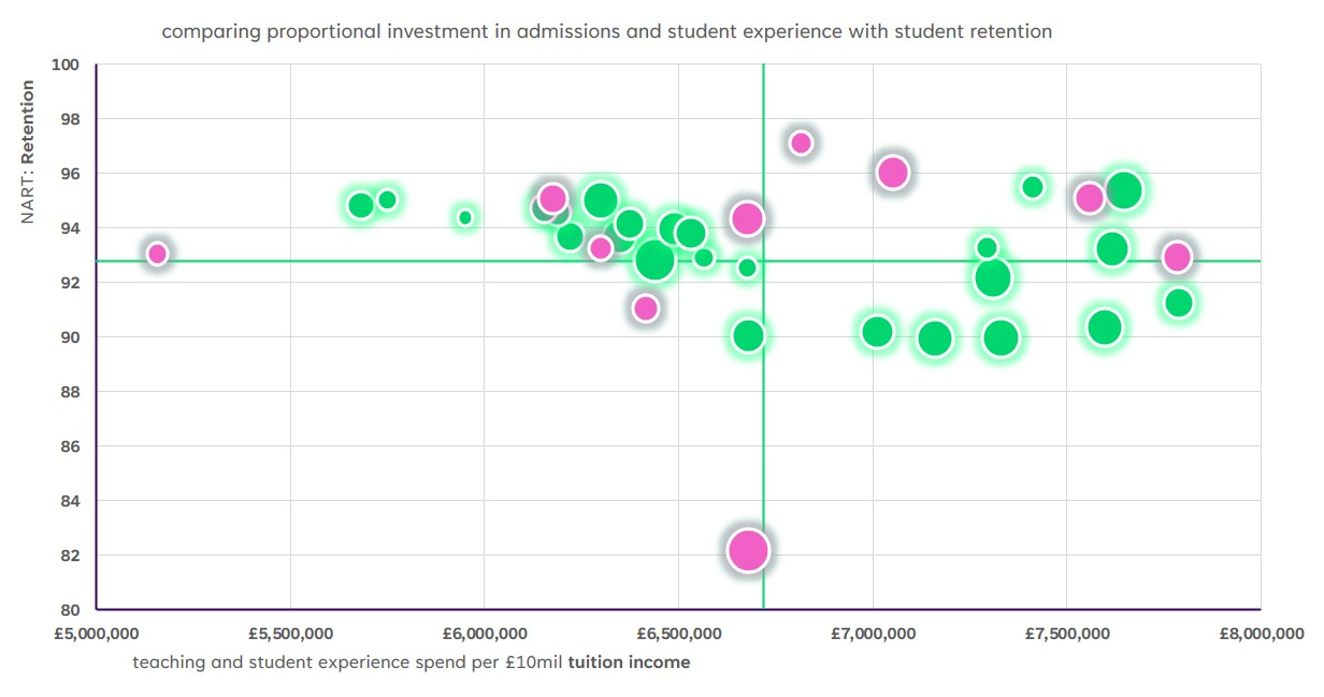
Colleges highlighted pink had >20% of tuition income relating to Adult Skills
Size of bubble relates to proportional spend on admissions: Large green = Admissions cost c.120k per £10mil, Small green = Admissions cost c.£20k per £10mil
Three colleges in this dataset make the point well.
One runs with proportionally low Teaching and Student Experience costs and low Admissions costs, and still posts an above-average retention rate. Another spends proportionally more across both of the same measures and achieves a similarly strong retention result. On paper, a comparison of those two colleges would flag a material cost gap yet the retention value tells you almost nothing about which one is ‘right’.
Then there's a third college that complicates the story further: Teaching and Student Experience spend broadly in line with the sector average, but a proportionally higher Admissions cost, and a retention rate well below everyone else in the group. If more spend reliably bought better outcomes, this is exactly the college that shouldn't exist on this chart. It does, and it's a useful reminder that resourcing a process generously and resourcing it effectively aren't automatically the same thing.
It's tempting to assume this college's high Adult Skills volume explains both the cost and the lower retention. The data doesn't fully support that: several of the pink-highlighted colleges, with similarly high Adult Skills volumes, post above-average retention while spending less on Admissions and the student experience. Profile is part of the picture here, not the whole of it.
What the cost data can't tell you is why. The two strong performers may have built lean, flexible systems that work by design, including cross-functional processes, digital workflow, staff who move naturally into Admissions activity when it matters, or simply resourced more generously to buy the same result. The weaker performer may be spending on the right things in the wrong way, or facing pressures the cost data doesn't capture at all: for example, application volume, local competition, or cohort profile.
All three examples point to the same underlying principle: what looks like a cost gap on a benchmark is very often a resourcing decision, but a resourcing decision doesn't automatically translate into results. The interesting question isn't whether the number is low. It's whether someone chose it to be, whether it's working, and how they'd know.
What This Means for How Benchmarking Should Be Used
I think this changes how comparative data should actually be used. The instinct, when a college is spending well below the norm on something, is to treat it as a risk, an area that looks under-resourced. Sometimes it is. But the data alone won't tell you that. What it can do is show you exactly where to ask a better question.
The next time a number looks low against other colleges, the better first question probably isn't “what's missing here?” It's “did someone decide this on purpose, and do they know whether it's working?”
If you would like to understand how Etio's Financial Benchmarking can support your organisation's transformation and efficiency projects, please get in touch with Phil Moseley and the Benchmarking team here.
